Francisco Galán

LinkedIn | Tableau Public | GitHub
Data Analytics and Visualization Specialist
I help people make better decisions using data.
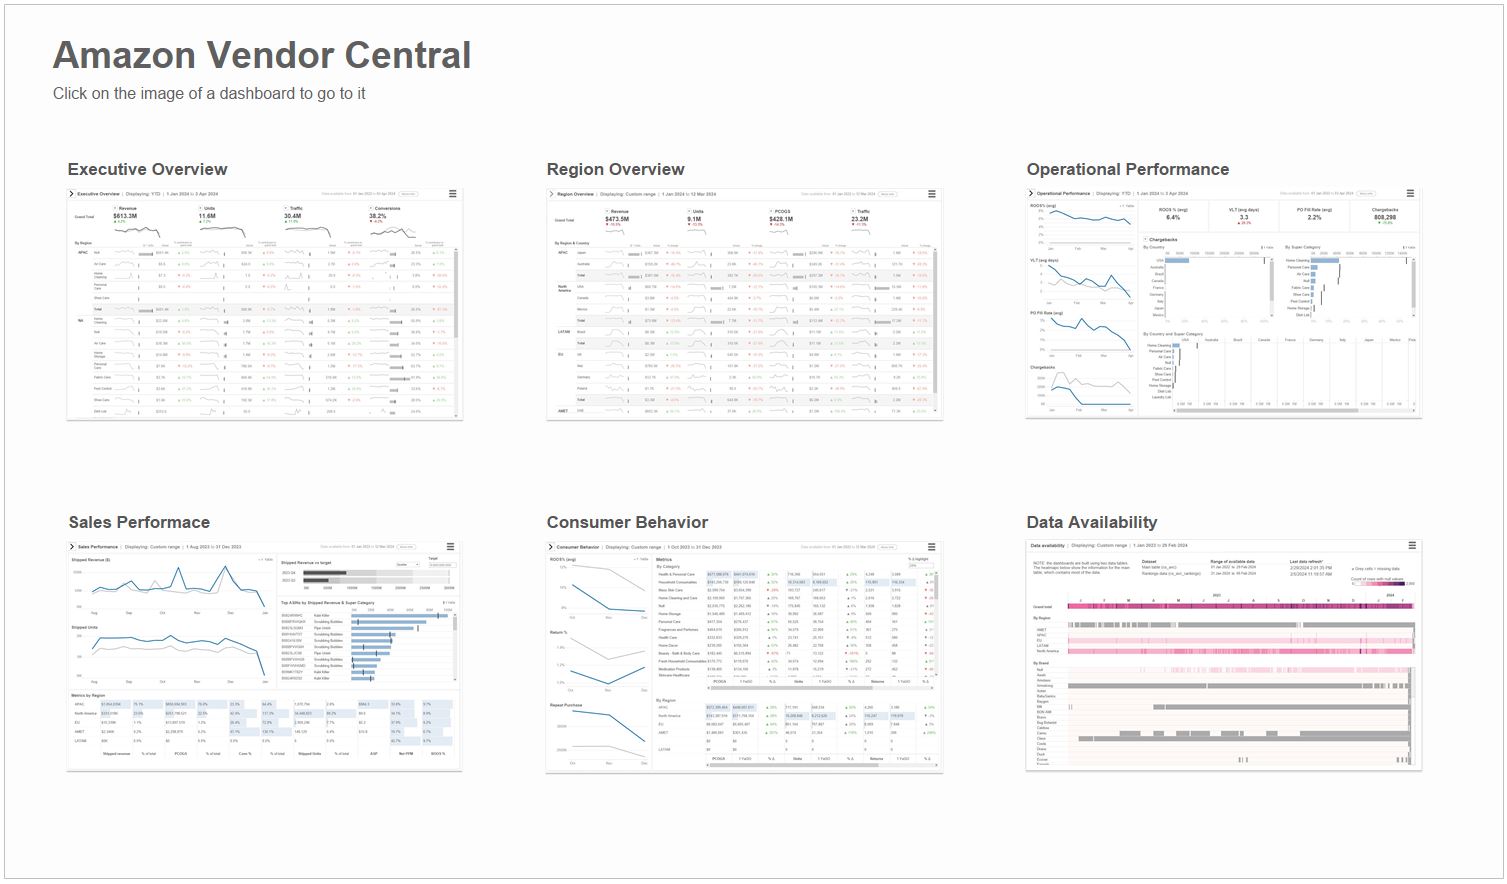
Sample Tableau Dashboards
Click on a dashboard to go to its version in Tableau Public:
My approach: I use a subtle, subdued visual design to draw attention to where it’s really needed.
I give priority to simple yet effective charts rather than inappropriate media or meaningless graph variety.
But if complexity or unusual layouts are called for, I find a way through.
Most importantly, I try to make it easy for users to answer actual business questions they might have.
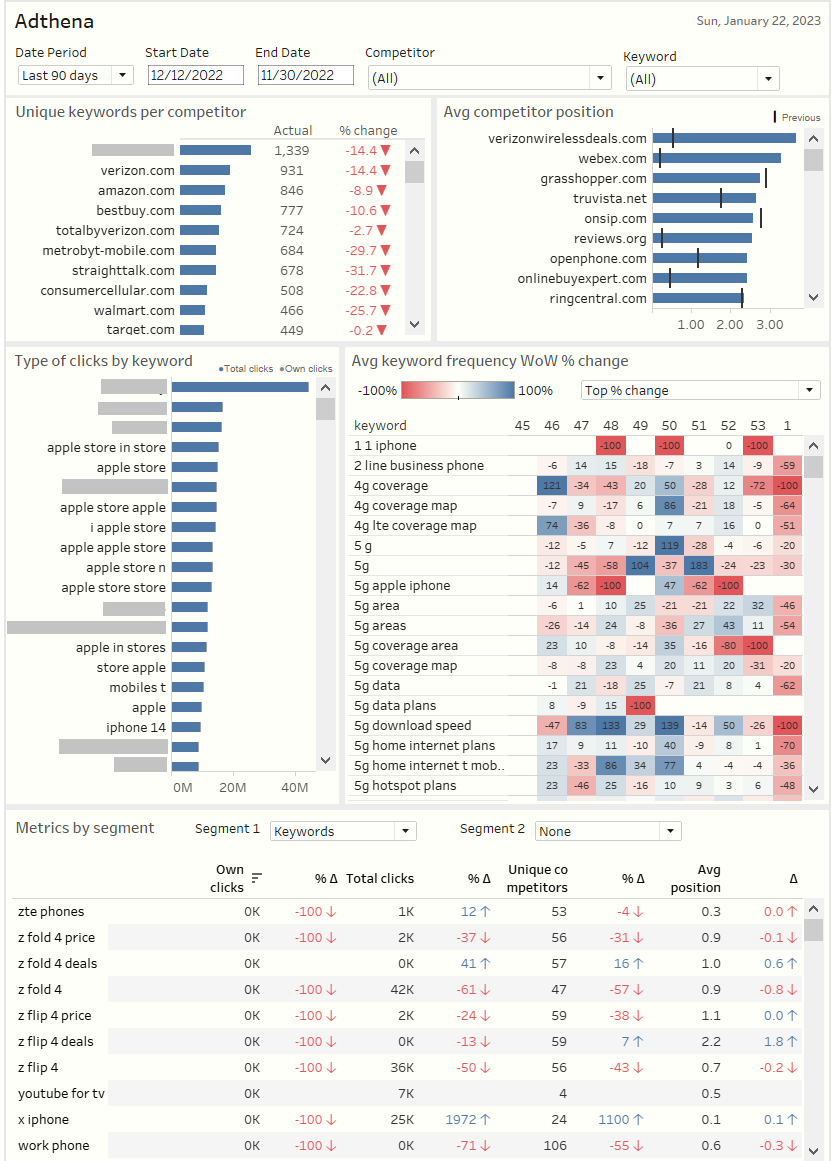
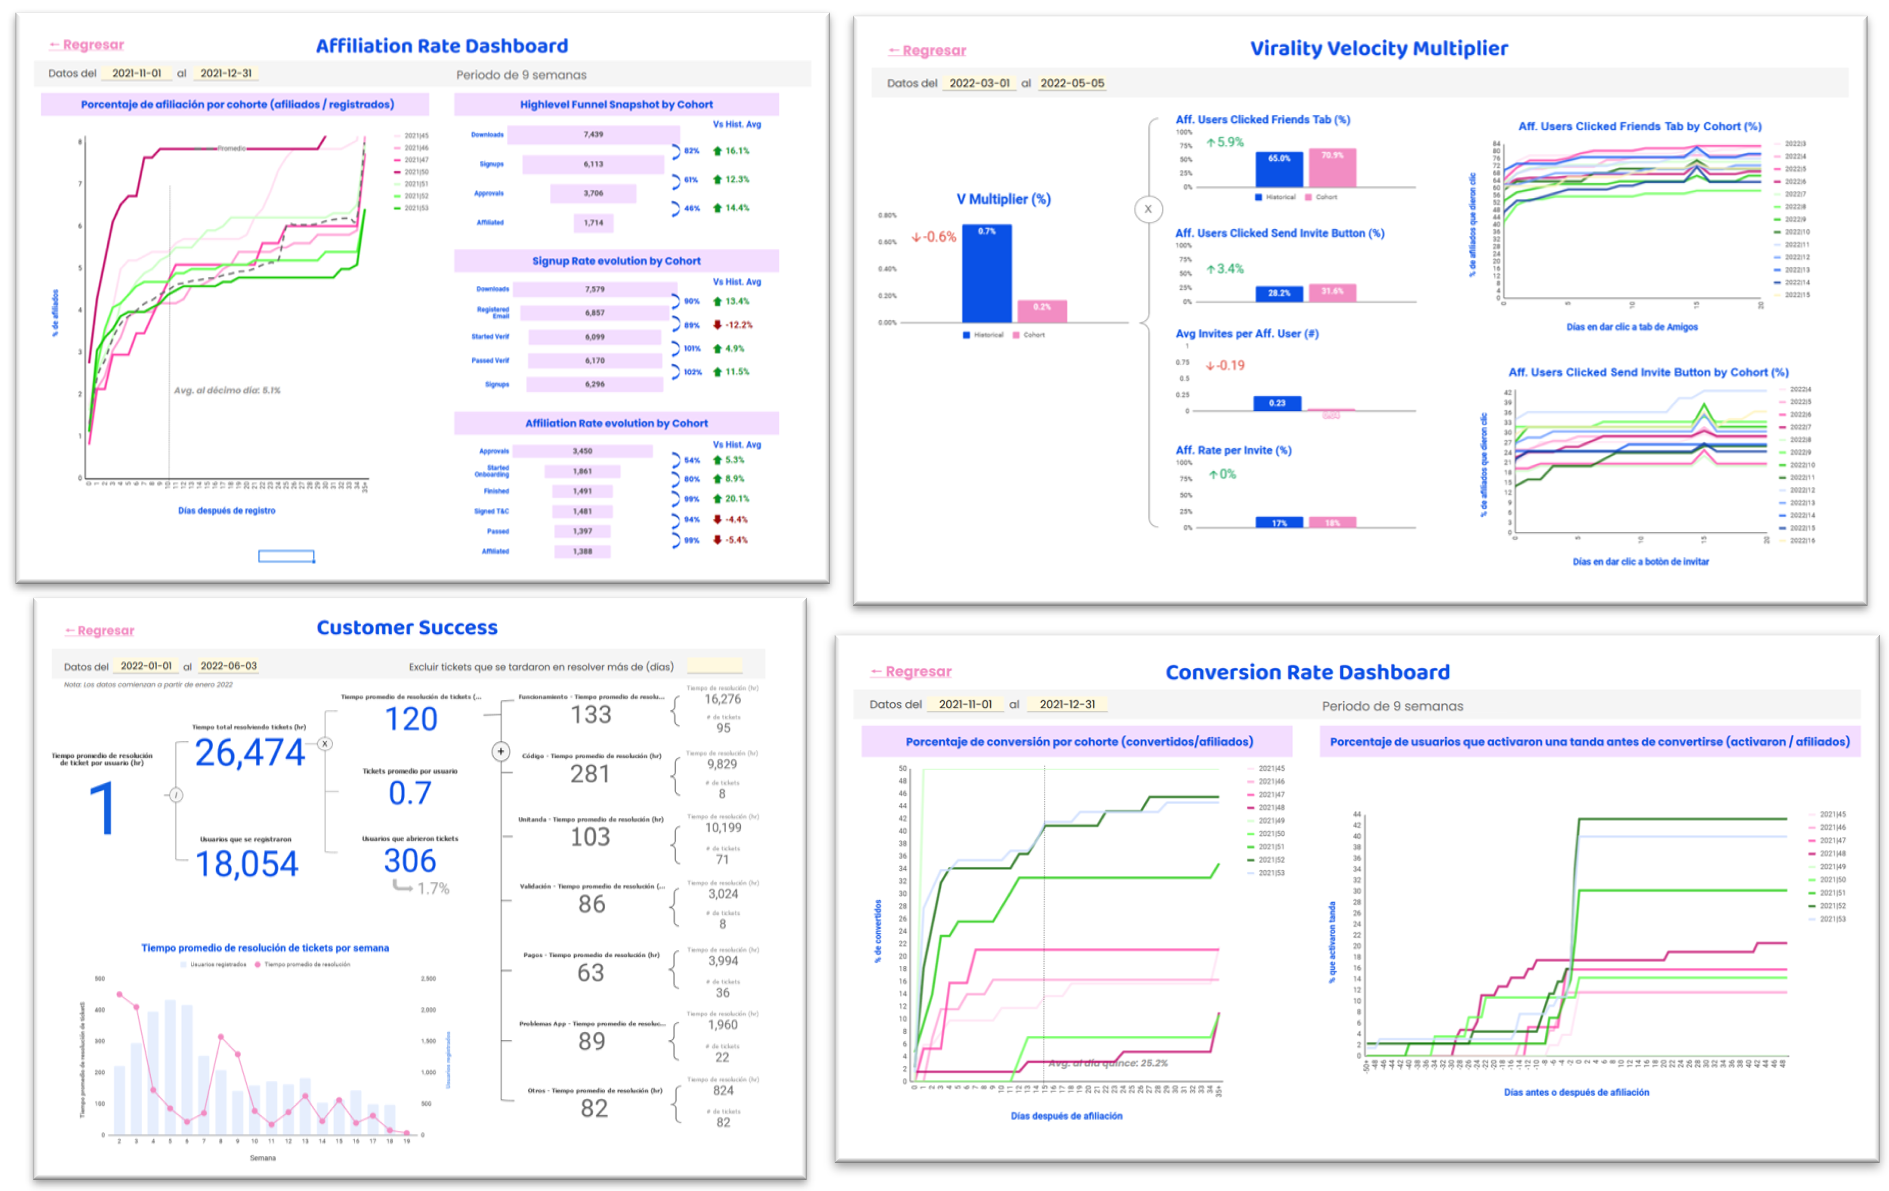
Business Health Dashboard
Tools: Python, SQL, Google Sheets
An automated dashboard that tracks affiliation, conversion, ticket resolution, and virality metrics by cohort.
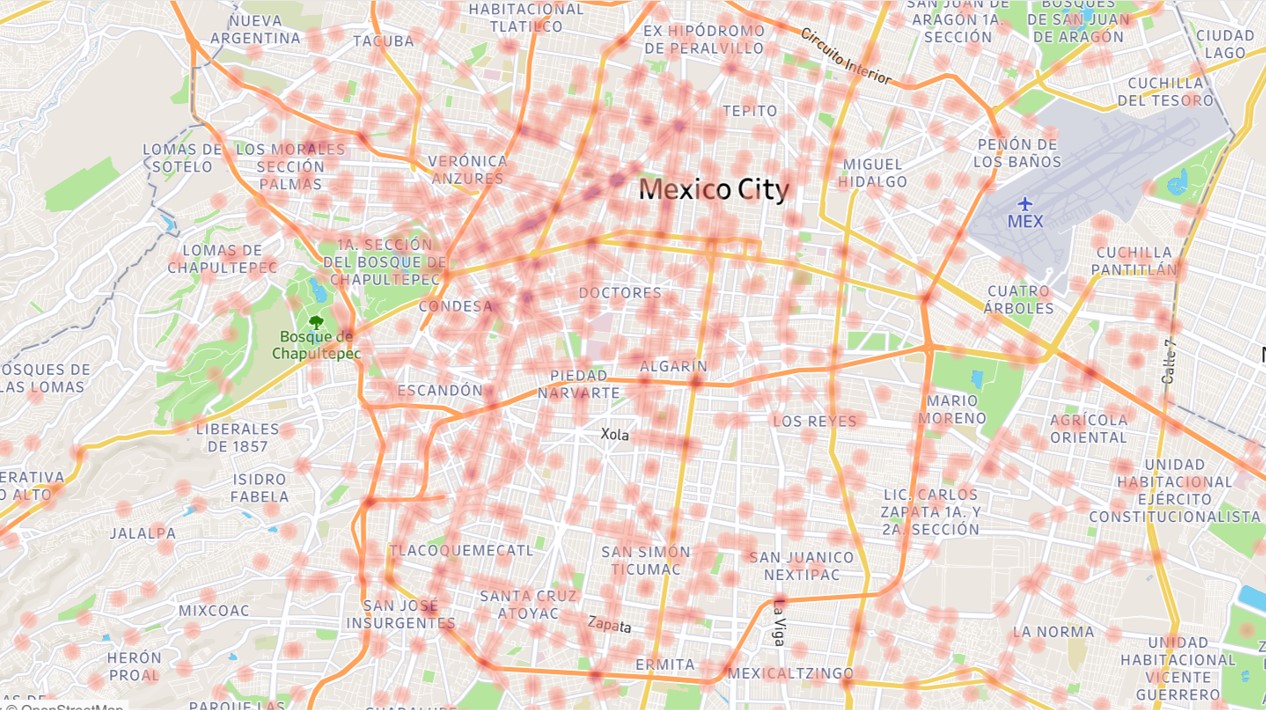
Bicycle Commuting Analysis
Tools: Python (pandas, regex, numpy, seaborn), Tableau, Git
Analyzed government data from 2015 to 2020 to determine which hour, day, month, and location is the safest to travel by bicycle in Mexico City.
Goodreads Book Recommender
Tools: Python (web scrapping, pandas, scipy)
A data analysis pipeline which recommends a list of books based on a Goodreads user’s reviews, his or her friend’s, and the books’ average ratings.